
Has the price of gold gotten too hot?
Gold prices have been hitting new records recently, surpassing the $3,000/ounce threshold thanks to safe-haven demand and strong central bank buying. After a slight decline late last week, gold prices recovered earlier this week as the US dollar weakened against other currencies.

Gold’s rally may be slowing. Technically, prices have run too far and may need a correction. In addition, some fundamental factors could put downward pressure on prices.
If geopolitical tensions ease, such as the conflict in Ukraine or Gaza, demand for safe havens will fall. Moreover, higher prices could spur gold miners to increase production and make central banks think twice before buying more.
Another factor to watch is the US stock market. If stocks stabilize or rebound, some investors may shift money from gold to riskier assets. Overall, though, the uptrend is expected to continue over the long term, although there may be short-term dips.
US Economic Data - What to Watch This Week
In the short term, gold prices will be largely influenced by the US dollar and upcoming economic data, with the core PCE inflation index - a measure favored by the US Federal Reserve - being the focus on Friday.
Recent inflation data has been mixed. While the CPI and RPI came in lower than expected, the University of Michigan survey showed rising inflation expectations. Fed Chairman Jerome Powell said long-term inflation remains stable, but markets remain concerned. If the PCE index rises more than expected, the dollar could strengthen and put pressure on gold.
Technical Trend - Bulls Still Dominate
Technically, gold remains in a clear uptrend, and the strategy of buying dips remains popular. However, some warning signs have emerged. The RSI on the daily chart shows that the bullish momentum is fading, although prices are still making new highs.
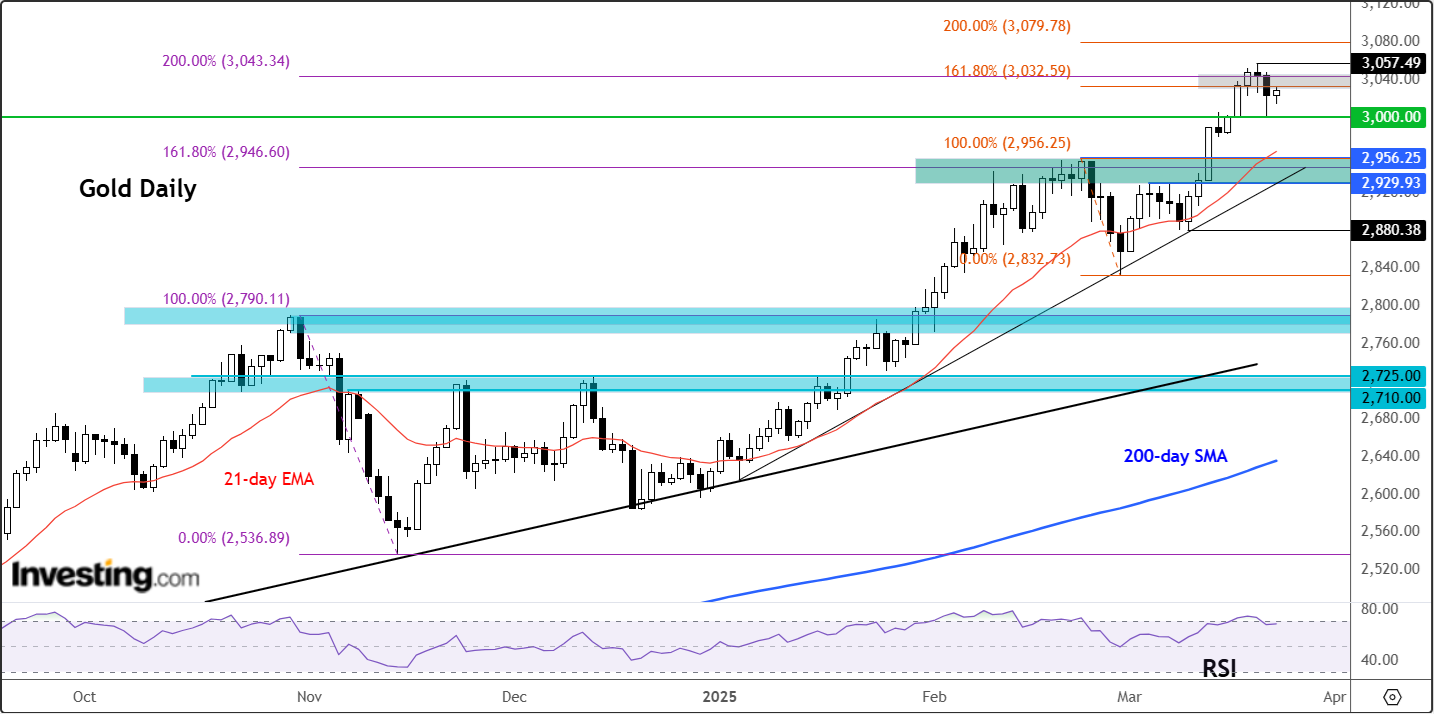
Last week, gold faced resistance around the $3,032-$3,043 area, where important Fibonacci levels converged. Although it reached a new peak of $3,057, the price closed below this area at the end of the week, indicating that the short-term uptrend is slowing down.
The $3,000 level is psychologically significant and held well into last week. A break below this level could trigger a sell-off. The next support zone is around $2,930-$2,956, which coincides with the 21-day moving average and a key uptrend line.
On the monthly chart, gold’s RSI has been above 70 since April 2024 and recently hit 80, a level that typically triggers a pullback. The same happened at the 2011 peak and during the pandemic. The weekly RSI, currently at 75, reinforces this warning.
Although the uptrend is still dominant, investors should be cautious of the possibility of a short-term correction. The market may need a period of stability or a slight decline to gain momentum for the next rally.
Source: https://baoquangnam.vn/gia-vang-tang-manh-lieu-co-sap-dieu-chinh-giam-3151318.html

![[Photo] Vietnam and Sri Lanka sign cooperation agreements in many important fields](https://vphoto.vietnam.vn/thumb/1200x675/vietnam/resource/IMAGE/2025/5/5/9d5c9d2cb45e413c91a4b4067947b8c8)


Comment (0)